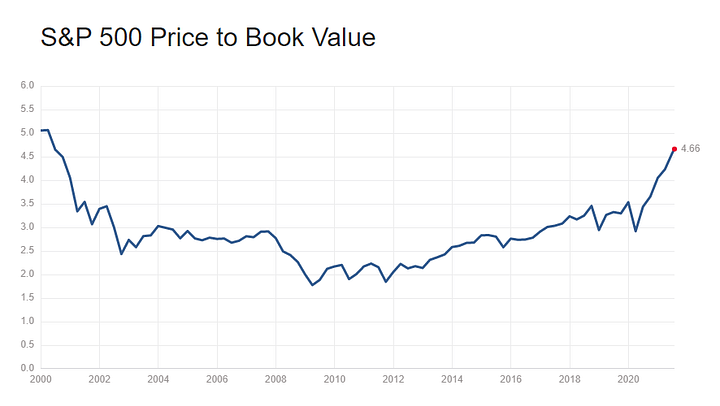
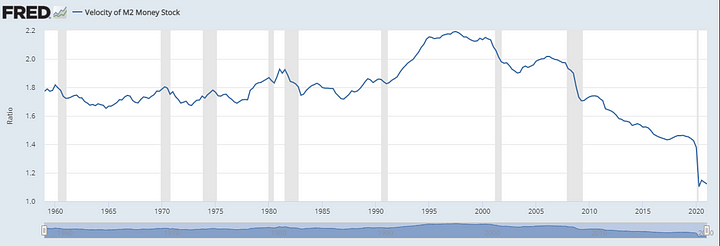
Since March 2020, the main US stock indexes are on a rising trend. In this period, the S&P 500 and the Dow Jones IA soared, respectively, 76% and 83%. PB is close to its record, and the velocity of money is at a record low. But what is the velocity of money and how is that related to the PB and the possibility of a crisis?
One could say that this is a mere correction from the enormous pandemic drop in the Q1 of 2020. But how so? The indexes already recovered and are far above the pre-COVID levels — by August 2020, the effects of the pandemic were gone. Most negotiated shares are at prices at least 30% higher than before the pandemic starts.
What we witness since mid-2020 is the sheer power of money pumped into the economy. The US spent more money fighting the Coronavirus’s economic effects than it spent in World War II. Different from other recent crises, where the stimulus came as corporate bailouts, this time it also took the form of stimulus checks.
Stimulus checks have a certain logic behind them. But there is a nefarious effect when you pump money into a developed economy during a short period. Instead of using the resources for paying bills or buying food, millions of Americans saved it.
This resulted in the lowest money velocity ever recorded in the US, and the near-record levels in the Price to Book of negotiated shares.
These two indicators, combined, draw a gloomy scene on the horizon. In this article, I will tell you why, but first, let’s understand what is Price to Book and the Velocity of Money.
What Price to Book Ratio Tells Us
Price to book value (PB) results from dividing the market value of a company’s shares (share price) over its equity book value. The book value is the value of the company’s equity (assets minus liabilities).
Imagine that you have a house that is assessed for 300 000 USD. You don’t want to sell it, so a buyer offers $300K, but you reject his offer. Let’s say that the buyer is the government and they need to purchase your house to demolish it and extend a rail line on its terrain. So the government offers you 360 000 USD, even though the book value of your house is 300 000.
Divide 360 000 by 300 000 and the result is 1.2. This is the PB of your house. Remember this number for the discussion that will come later.
How do investors use the PB? Ben Mcclure, writing for Investopedia, explained:
Investors use the price-to-book value to gauge whether a stock is valued properly. A P/B ratio of one means that the stock price is trading in line with the book value of the company.[…] A company with a high P/B ratio could mean the stock price is overvalued, while a company with a lower P/B could be undervalued. […] For example, if a company has a price-to-book value of three, it means that its stock is trading at three times its book value. As a result, the stock price could be overvalued relative to its assets.
The world could in Ben’s explanation, is crucial. Not always a high PB means an overvalued stock. If the company has a high ROA (return over assets) and its profits are booming, the PB will reflect an expectation of increasing assets in the future. However, the high PB, in this case, shows that most of the good expectations are already priced into the stock. As a result, any additional good news will have its impact reduced, and a piece of bad news can be catastrophic.
Catastrophic enough, for example, to make the 8th richest man lose 99.8% of his fortune in a time span of a few months.
What Is Happening With the Price to Book Value of the S&P 500?
Remember the previous example of the house with a PB of 1.2? It sounded pretty attractive to the seller, right?
Shares often trade above that value because we expect companies to generate yield — meaning, income. Houses do not produce yield unless you are renting them or offering your spare rooms on Airbnb.
The median P/B for the S&P 500 (the 500 largest U.S. publicly traded companies) is 2.78. During the last 20 years, it oscillated between 1.7 and 3.5.
Since August 2020, however, it skyrocketed, reaching a whopping 4.66. It is near the highest value ever recorded, a 5 in 2000.
Sectors, as non-essential consumer goods and information technology, are trading at two-digit PB values.

What is the Velocity of Money?
The velocity of money is the average number of times one dollar (or any other currency) is used to buy things in a certain amount of time (a month, a quarter, a year, etc).
Let’s imagine a fictitious, tiny country with a currency called Plim, with only 2 people. One is a fruit seller, and the other is the owner of the house where the fruit merchant lives. The sum of all Plims in the economy is 200. In a given week, all the transactions that happened in this country are the house owner buying 120 plims in fruits from the seller and the seller paying 120 plims in rent for the landlord.
The total money circulated was 240 plims. This means a velocity of money of 240/200 = 1.2 per week in our tiny, fictitious country.
This example is a simplified explanation of the velocity of money, but this indicator is used on a much larger scale to measure the transactional activity of entire countries. It also can have a drastic impact on the GDP — or be impacted by it, depending on the perspective.
The velocity of money equation can be calculated as the GDP divided by money supply.
The Velocity of Money = GDP ÷ Money Supply
If the velocity of money increases, that means more transactions between individuals in an economy. It is an important indicator to measure the rate at which money in circulation is being used for purchasing goods and services. Economists use it to assess the economy’s health. As James Chen summarized:
High money velocity is usually associated with a healthy, expanding economy. Low money velocity is usually associated with recessions and contractions. […] Therefore, the velocity of money will usually rise with GDP and inflation.
How Low Is the Velocity of Money in the US?
Now that you know what is the velocity of money, there is no need for half-words here. It is low.
Very low.
Lower than the emotional maturation of a spoiled teenager, lower than the number of Polish good footballers, lower than the opposition to Kim Jong Un.
The velocity of money in the US is at the lowest value ever recorded.
Remember the fictitious example of our tiny country, with a velocity of 1.2 per week? The US now has a velocity of 1.12.
Not per week, not per month, but per quarter.
The downward trend is not new, starting in 2005. But in 2020 it plunged. The billions issued by the US government, instead of being spent on food, mortgage, or consumer goods, were used to buy shares, index funds, or other investments. The meme of Redditors using their stimulus checks to buy GameCorp and troll hedge funds is not just a meme.
What Does This Combination Mean?
The record-low velocity of money is linked with the record-high Price to Book values. The US government issued almost half a trillion dollars in stimulus checks. This money tsunami pumped stock indexes to record levels.
But what comes next? The best way to explain that is another example.
Imagine that you have 100 shares from a company that distributes, on average, $40 in dividends per year. When you bought these shares, you paid 5 dollars per each, meaning a total investment of $500. So you have a return of 8% per year considering only dividends.
Not bad.
But then the government begins to distribute stimulus money, and more people invested in these attractive shares. Its prices soared by 300% — something not uncommon since August. Companies like Digital Turbine or SM Energy saw their shares increase way more than that.
These same 100 shares are now worth $2000. Unless the company revolutionized its operations to increase its profits in the same proportion, the dividend is still around $40 per year. But now, that means only 2% return.
Maybe some investors are ok with a 2% of return, but many of them will sell their shares and cash their profits.
Then comes the stock market dip. That is just the first part of the disaster.
The Inflationary Super-Wave
Investors cashing their profits will be tempted to use their once-stimulus money for what was the original purpose of it: buy consumer goods.
When that happens, however, not only the economy will be almost back on track, but the money volume tripled.
What happens when 1.5 trillion dollars is used on a spending spree for new cars, houses, holidays, $4000 Italian shoes, and so on?
You know what happens. You know, because it already started.
We are already at the highest inflation levels of the last 40 years. The accelerated price changes are one of the reasons several businesses will failin the post-COVID era.
Professions and entire industries will disappear.
There are companies and entire industries that benefit from higher inflation. There is leeway, but it is narrow.
Besides these top Fiverr gigs, there are more you can explore (and profit) from freelancing platforms and gig economy. Check the links below.
The 5 Best Fiverr Gigs Expatriates Can Offer to Make $ Abroad
The 5 Top Fiverr Gigs for New Entrepreneurs and Creators
To Join Fiverr and start with a $20 Bonus, Click Here.
Join Freelancer using this link and earn a USD20 discount on your first purchase
Levi Borba is CEO of expatriateconsultancy.com, creator of the channel Small Business Hacks, and best-selling author. You can check his books here, his other articles here, or his Linkedin here.


